Ambition
Reduce greenhouse gas emissions in alignment with global ambitions to limit climate change to 1.5°C.
Achievements
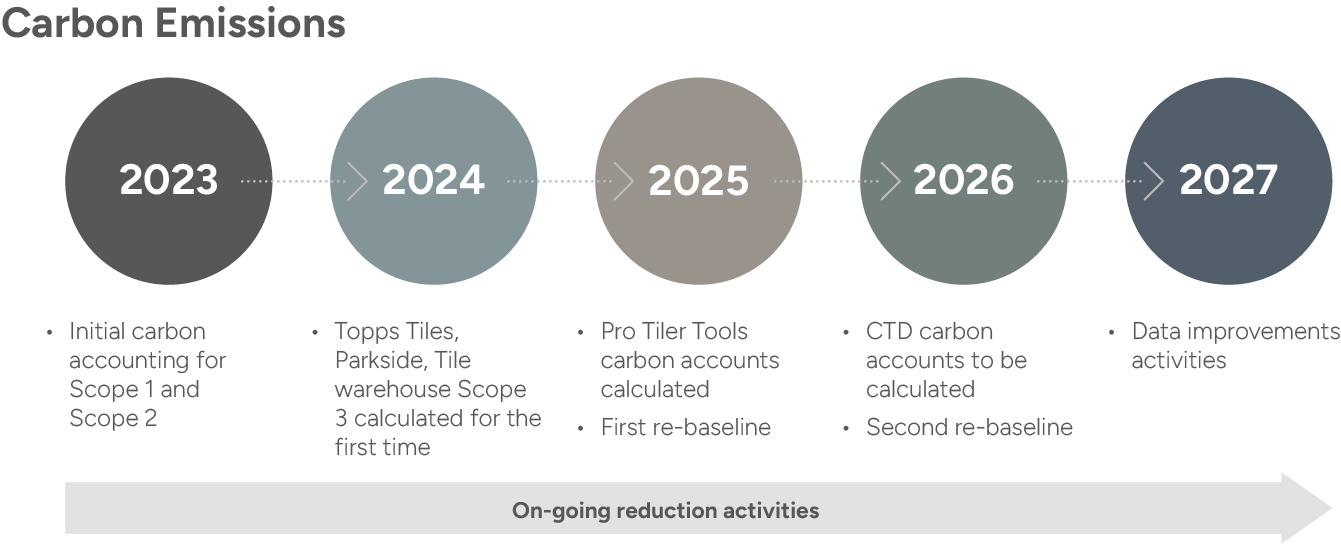
Our Strategic Roadmap: Scope 1 & 2 carbon neutrality
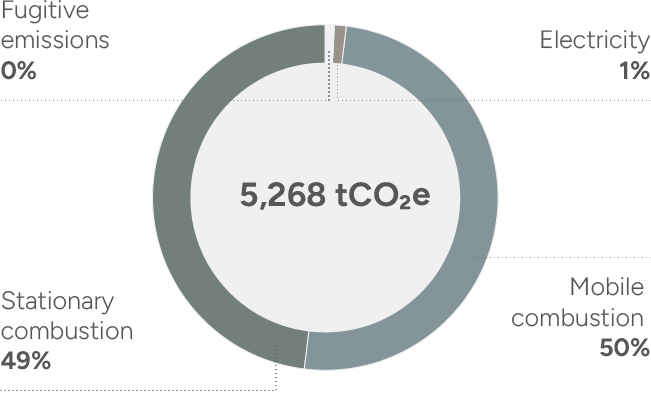
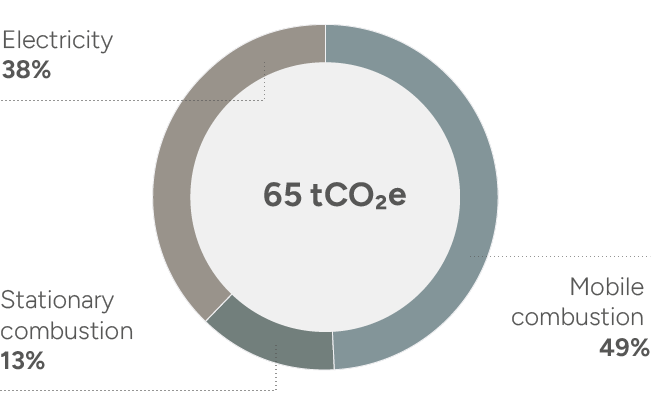
Our Scope 1 consists of stationary combustion – gas/ oil-fired heating in our stores, head office and distribution centre; mobile combustion – transport via primarily diesel-fuelled company vehicles; and fugitive emissions – refrigerant leaks where the chemical is listed in the Kyoto Protocol.
This year’s data also includes Pro Tiler Tools including the new DC2 site. By restating our baseline, our emissions increased by 45 tCO2e for FY23 and 168 tCO2e for FY24, due to the inclusion of Pro Tiler Tools for the first time.
Our energy consumption remains similar to last year; however, our Scope 2 emissions have significantly reduced. As of January 2025, the DC2 site joined the rest of the Group on a renewable energy contract, improving our Scope 2 emissions for this year. This means that the Pro Tiler Tools aspect of the Scope 2 emissions reduces by 91% in FY25 (market-based).
With almost all of the Group’s carbon accounts reported this year, a reduction target can be set. We are committing to a near-term 42% reduction target for all parts of the Group in Scope 1 and 2 by 2030, where Scope 2 is market-based. This represents a real reduction of 2,167 tCO2e by 2030 from the FY23 baseline, which will be achieved through the switch to a fully renewable energy contract completed in FY25, transitioning our fleet to HVO and the move away from gas fork-lift trucks to electric.
Reduction Strategy
Through FY25 we have remained committed to reducing our carbon emissions and have continued from the progress made in FY24. Our ongoing partnership with Normative has enabled us to report on Pro Tiler Tools carbon footprint for the first time.
The continued efforts to decarbonise have been addressing the heating of all our Group locations and vehicles, ultimately transitioning to electrified versions when technology becomes available. This year we have made progress against our short-term goals and are committed to invest in carbon reduction initiatives and in 2030 we will look to offset any unavoidable emissions.
This year we have reviewed the commitment to submitting our reduction targets to the Science-Based Targets Initiative (‘SBTi’) for validation. Our review highlighted that due to further planned re-baseline activities in FY26, and having limited control over key categories and SBTi requirements, setting SBTi targets will not be feasible at this stage. We intend to review this again in FY27 and are committed to science-based-aligned targets.
Topps Tiles, Tile Warehouse, Parkside Scope 1 and 2
Pro Tiler Tools Scope 1 and 2
| Short term 1 to 3 years | Medium term 4 to 15 years | Long term 16 to 30 years | ||
|---|---|---|---|---|
| Scope 1 Transport | Haulage fleet 20% switch to HVO | |||
| Majority haulage fleet switched to HVO | ||||
| Electrification of haulage | Forklifts only | |||
| Property | Gas efficiency upgrades | |||
| Electrification of heating | ||||
| Scope 2 Property | 100% renewable electricity | |||
| Photovoltaics on all viable stores | ||||
Scope 3
Background
Scope 3 emissions refer to all other indirect emissions that occur across the entire value chain. We report upstream emissions – all purchased goods and services, transportation of products and people as business travel or colleague commuting, and all wastes within our operations; and downstream emissions – the use of sold products and sold products end-of-life treatment. These emissions account for 97% of our carbon footprint, which is reflective of both the construction and retail sectors where supply chains are complex.
Our methodology follows the hybrid method; we utilise activity-based data, alongside spend-based data to build a complete picture of our emissions. Activity-based data includes Environmental Product Declarations (‘EPDs’) that provide independently verified emissions data for specific products, which some of our suppliers have provided to us. These EPDs are either generic, covering several companies, factories and location, or the more accurate supplier-specific that cover one supplier and only their specified factories.
By reporting Scope 3 emissions, we are taking a critical step toward greater transparency and accountability. This data provides a robust, quantitative foundation for assessing the environmental impact of our business decisions and identifying opportunities for meaningful carbon reduction. It also positions the Group to respond proactively to evolving climate regulations and market expectations, reinforcing our role as a responsible business advancing Environmental Leadership. We are equipped to meet regulatory demands such as the Task Force on Climate-Related Financial Disclosures (‘TCFD’), while providing stakeholders with full-scope climate disclosures.
Results
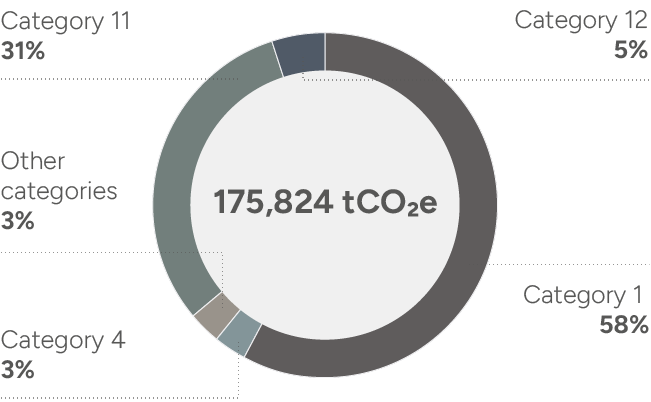
Similar to previous years and with the inclusion of Pro Tiler Tools, the majority of Scope 3 emissions sit within category 3.1 Purchased goods and services, accounting for 108,980 tCO2e. This aligns with expectations and reflects the sectors in which Topps Group operates, notably the carbon-intensive construction industry. Our product portfolio is heavily weighted towards tiles and tile adhesives, both of which have inherently high carbon footprints. These will require significant technology development to manufacturing methods to reduce the related emissions.
The next highest category is category 3.11 Use of sold products, contributing 74,231 tCO2e to our footprint. This covers the lifetime energy consumption of all electrical products sold across the Group, where our underfloor heating systems are a major contributor. For lifetime electrical energy usage to decrease, we are reliant on more energy efficient models and the increase of renewable electricity on the UK national grid. Encouragingly, the UK government’s commitment to achieving 100% renewable electricity generation by 2035 means that emissions in this category are expected to decline substantially over time, independent of Group strategy. The remaining aspects of Scope 3 are much smaller, nevertheless these categories form a meaningful part of our strategy reduction plan. It should be noted that within Topps Group, Scope 3 will include some spend data from CTD where it is not possible to separate invoices in the cases of overlapping suppliers. CTD will be reported in full in the FY26 Annual Report.
Topps Tiles, Tile Warehouse, Parkside Scope 3
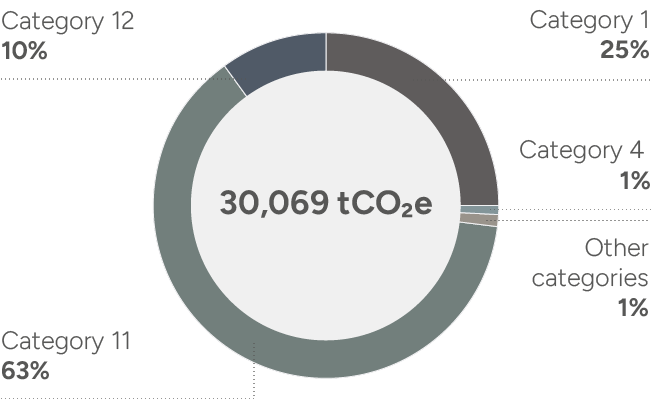
Pro Tiler Tools Scope 3
| Upstream | FY25 (tonnes) | |
| Category 1 – Purchased goods and services | 108,980 | 53% |
| Category 4 – Transportation and distribution | 5,957 | 3% |
| Other categories combined – 2, 3, 5, 6, 7 and 8 | 5,558 | 3% |
| Downstream | FY25 (tonnes) | |
| Category 11 – Use of sold products | 74,231 | 36% |
| Category 12 – Product end-of-life treatment | 11,167 | 5% |